-20578.png)
What Is the Results Section of a Research Paper?
The results section is where researchers report what the data showed, organized logically to address each research question or hypothesis. It sits between your methodology and discussion after the "how you did it" and before the "what it means."
Your job here is purely presentational. You're not arguing a case or drawing conclusions. Think of it as the evidence room: your job is to lay out the facts, not argue the case.
This section is also distinct from your conclusion and discussion. In the discussion, you'll analyze what your findings mean, connect them to existing literature, and offer explanations. In the results section, those conversations don't happen. You state what you found, show the supporting data, and move on.
| A quick frame that helps: if the sentence starts with "This suggests..." or "This means that...", it belongs in the discussion, not here. |
What to Include in the Results Section
Everything in the results section must trace back to your research question, if it doesn't, it doesn't belong here. Here's what typically goes in:
- Data presentations: Tables, figures, and the narrative text that references them. You don't get to pick just one format; each has a role (more on that in Step 3).
- Statistical outcomes (for quantitative research): It should have means, standard deviations, p-values, confidence intervals, effect sizes. Present the numbers that answer your research questions.
- Thematic findings (for qualitative research): The patterns, categories, or themes that emerged from your data, supported by representative quotes or examples.
- Negative or unexpected results: Yes, include these. If your hypothesis wasn't supported, report it. Omitting null results is a form of research distortion, and reviewers will notice.
- References to appendices: If you have raw data or supplementary tables that are too detailed for the main text, move them to appendices and reference them here: "Full data tables are provided in Appendix A."
| Organizing results also helps to mirror the structure of your research paper methodology section, the variables and procedures you described there should map directly onto the results you're now reporting. |
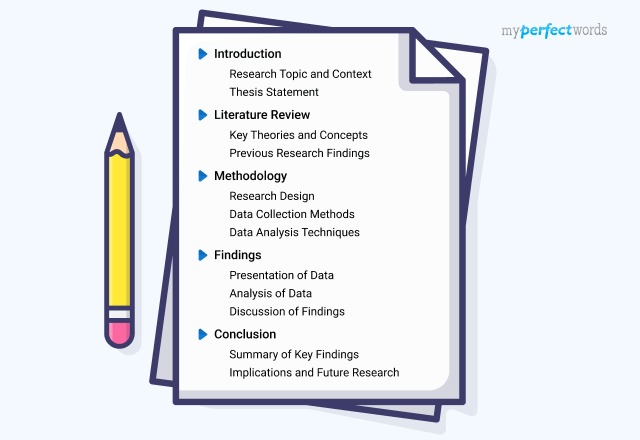
How to Write the Results Section of a Research Paper (Step by Step)
Step 1: Organize Your Results Before You Write
Before you write a single sentence, map out the order. The most logical approach is to follow the same sequence as your research questions or hypotheses. If your study asked three questions, your results section should present findings in that same order.
This isn't just about structure, it's about making your results readable. A reader who just finished your methodology section knows what questions you set out to answer. If your results follow the same sequence, they can track your findings without getting lost.
Use subheadings for different analyses, especially if your study covered multiple questions or datasets.
| You can also align with your research paper outline here, the structure you planned at the start should guide how you present findings now. |
Step 2: Report Data Objectively
This is the core discipline of results writing. You state what you found, not what it means, not why it happened.
Use past tense throughout:
| "The study found..." not "This suggests that..." Include specific numbers where they exist. "Participants in Group A scored significantly higher" is weaker than "Participants in Group A scored an average of 78.4 (SD = 5.2), compared to 61.9 (SD = 6.7) in Group B (p < .001)." |
Here's the distinction that trips most students up:
Objective reporting (correct): "Group A reported higher satisfaction scores than Group B on all three measures."
Interpretation sneaking in (incorrect): "Group A reported higher satisfaction scores, which likely reflects their prior experience with the subject matter."
Your job in the results section is to report what happened, not explain why it happened, that comes in the discussion. If you catch yourself explaining, flag that sentence and move it.
| For established statistical reporting standards, refer to the APA Publication Manual as the authoritative reference. |
Step 3: Use Tables and Figures Effectively
Tables and figures aren't interchangeable. Use them based on what you're trying to show.
Use a table when readers need precise values, means, standard deviations, frequencies, cross-tabulations. Tables are for when the specific number matters.
Use a figure (chart, graph, diagram) when you want to show trends, comparisons, or patterns visually. A bar chart showing a clear performance gap communicates faster than a table of numbers.
Every table and figure must be referenced in your text. Don't insert a table and let it float there unexplained. Reference: "As shown in Table 2, response rates declined steadily across all three time points."
| Just as importantly: don't repeat in prose what the table already shows. Describe it, point to the key finding, but don't write out every number the table already contains. That's redundant and signals to reviewers that you're padding. |
Make sure every table and figure has a clear, self-explanatory title and caption. A reader should be able to understand what it shows without reading the surrounding text.
Step 4: Highlight Patterns and Trends
After you've reported your raw data, briefly note the significant patterns. The key word is "note", you're pointing, not analyzing.
Use neutral, precise language: "The data showed a consistent increase across all four measurement periods."
Not: "Interestingly, there was a consistent increase..." The word "interestingly" is a judgment call, which makes it an interpretation.
| Other words to avoid: "surprisingly," "unfortunately," "remarkably," "it's notable that." These all introduce your opinion into a section where your opinion doesn't belong yet. |
The connection you're drawing here is backward-looking: does this finding address the research question you set out to answer? Briefly signal yes or no. That's it. The explanation of what it means waits for the discussion.
Step 5: Address Negative and Unexpected Results
Negative results aren't failed results, they're still results. If your hypothesis wasn't supported, report it plainly.
Don't hide null findings, bury them at the end, or minimize them with hedging language. Report them in the same sequence and with the same level of detail you'd give to positive findings.
Here's example language for reporting negative results:
"Contrary to our hypothesis, no significant difference was found between groups on the primary outcome measure (p = .43)." "The predicted relationship between variables X and Y was not supported by the data (r = .08, p = .61)." "Results did not replicate the findings reported by [previous study]." |
State it, show the data, and move on. You'll have room to contextualize and discuss it in the discussion section. Here, you're just reporting the fact.
Step 6: Use Subheadings for Complex Studies
If your study covered multiple research questions, datasets, or participant groups, subheadings aren't optional, they're necessary. A results section without structure becomes unreadable past a certain level of complexity.
Your subheadings should mirror the organization of your methods section where possible. If you described three separate analyses in your methodology, create three parallel subsections in your results. This parallelism helps readers navigate without having to reread everything to reorient themselves.
Each subheading should be clear and descriptive: not "Results 1" but "Results for Research Question 1: The Effect of Study Duration on Retention."
Step 7: Cite Appendices for Raw Data
Not everything belongs in the main text. When you have detailed data tables, interview transcripts, coding frameworks, or supplementary analyses, move them to numbered appendices.
In the main text, reference them cleanly: "Complete descriptive statistics for all variables are provided in Appendix A." "Full interview transcripts are available in Appendix B."
| The decision rule: if the data is necessary to understand your findings, keep it in the main text. If it's supporting detail that a reader might want but doesn't need to follow your argument, it goes in an appendix. |
Label your appendices clearly and consistently (Appendix A, Appendix B, etc.), and make sure every appendix you create is actually referenced in the body of the paper. An unreferenced appendix is just clutter.
Step 8: Connect Results to Research Questions
Close your results section with a brief signal that ties your findings back to the questions you set out to answer. This isn't interpretation, it's orientation.
| Something like: "Together, these findings provide partial support for the study's first hypothesis and do not support the second. The implications of these results are addressed in the discussion section." |
That's the handoff. You're not explaining what it means, you're pointing the reader toward what comes next. You've reported the evidence. Now you're passing the baton.
| You might also find it helpful to review the research paper conclusion guide, the conclusion draws on both your results and discussion, so knowing how they relate helps you stay in the right lane while writing each section. |
Let a Pro Handle Your Results Section
Our writers know exactly how to report findings clearly, and keep the discussion where it belongs.
Let our experts handle your research paper from start to finish.
Presenting Quantitative vs. Qualitative Results
The way you write your results depends heavily on what type of data you collected. Quantitative and qualitative studies have different conventions, and mixing them up is one of the more common structural mistakes in student papers.
Writing Quantitative Results
Quantitative results are built around numbers: means, frequencies, percentages, effect sizes, and tests of statistical significance. Your job is to present these clearly without turning the section into a statistics lecture.
Report the statistical test you used and its outcome. Don't explain what a p-value is, assume your reader knows.
| Just give the result: "A one-way ANOVA revealed a significant effect of condition, F(2, 87) = 14.3, p < .001." |
Use tables to present summary statistics across multiple variables. Don't reproduce in text what the table already shows, refer to the table and highlight the key finding:
| "As shown in Table 1, Group A demonstrated significantly higher post-test scores across all three outcome measures." |
An example of clean quantitative results writing:
| "Participants in the intervention group completed an average of 8.4 tasks (SD = 1.9) compared to 5.7 tasks (SD = 2.3) in the control group. This difference was statistically significant (t(58) = 5.01, p < .001, d = 1.28)." |
Note what's absent: no explanation of why the difference occurred. That's for the discussion.
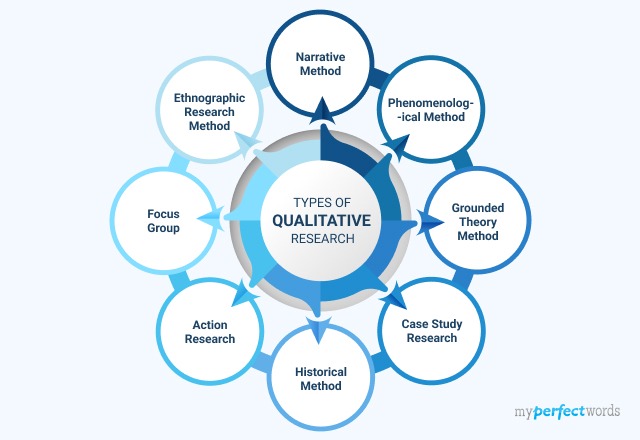
Writing Qualitative Results
Qualitative results are organized around themes, patterns, or categories that emerged from your data, interviews, observations, documents, or other non-numerical sources. The structure is different, but the discipline is the same: report what you found, don't interpret it.
Use subheadings for each theme. Under each theme, explain what it is and support it with representative quotes or examples from your data.
The results section of a qualitative research paper example:
| "Three primary themes emerged from the interview data: academic pressure, time management challenges, and social support networks. Participants consistently described academic pressure as the dominant stressor, as illustrated by one respondent: 'I feel like I'm running a race where the finish line keeps moving.'" |
Qualitative results sections can run longer than quantitative ones, that's normal. You're presenting evidence that's narrative by nature. Still keep your descriptions focused on what the data showed, not what you think it means.
| If you've already drafted the section, learning how to edit a research paper can help you tighten it up with fresh eyes. |
Results Section vs. Discussion Section: What's the Difference?
This is the question that comes up most often, and it's worth answering directly because the line gets blurry when you're deep in writing mode.
- Results: What you found. Facts, data, observations. Reported in past tense. No opinions.
- Discussion: What it means. Analysis, interpretation, comparison to prior research, explanation of unexpected findings, implications.
- The practical test: If you're explaining why something happened, you've left the results section.
Here's a quick comparison:
Results Section | Discussion Section |
"No significant difference was found between groups." | "The lack of significant difference may reflect insufficient statistical power." |
"Participants in Group A completed 40% more tasks." | "This performance gap likely reflects the training intervention's effect on task familiarity." |
"Three themes emerged from the data." | "These themes align with existing literature on student burnout." |
| Results = stating a fact. Discussion = making an argument. |
If you use the phrase "this suggests," "this indicates," or "this may be because," you've crossed into discussion territory. Pull those sentences out and save them for the next section.
| When you're ready to write that section, check out our guide on the research paper discussion section for how to handle the transition. |
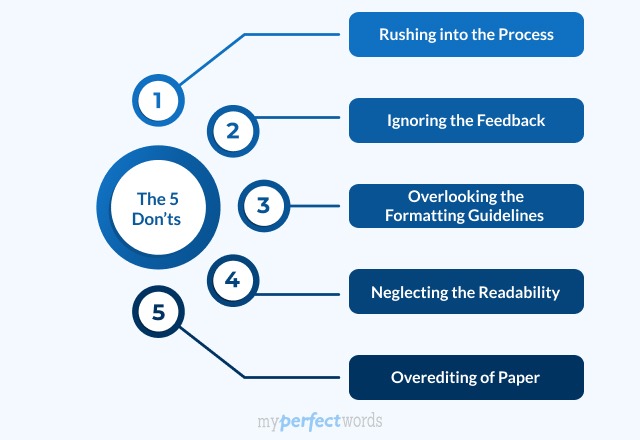
Common Mistakes to Avoid in the Results Section
These are the errors that specifically affect the results section, not general writing mistakes, but the patterns that tend to show up when students are writing this section for the first time.
- Including interpretation or speculation: If you're explaining why a result happened, that's discussion, not results. Pull it out.
- Leaving out negative results: Null findings are findings. Omitting them misrepresents your research and can get flagged during peer review or grading.
- Repeating what tables already show: Reference your tables and highlight key points. Don't write out the numbers the table already presents.
- Using emotional or subjective language: Words like "surprisingly," "unfortunately," "remarkably," and "it's interesting that" all introduce your perspective. This section is objective.
- Presenting data with no connection to the research question: Every result you report should connect back to a specific research question or hypothesis. If you can't make that connection, the finding may not belong in the main text.
- Ignoring figures and tables in the text: Every visual you include must be referenced in the body of the paper. An unreferenced table is invisible to readers who are following the text.
| Before you submit, it's worth running a full research paper checklist to catch these and other common issues. |
Conclusion
Writing the results section doesn't have to feel like walking a tightrope. Once you understand the core rule, report what the data showed, save what it means for the discussion, everything else falls into place. Organize your findings around your research questions, use tables and figures where the data earns them, and report negative results with the same care you'd give positive ones.
The line between results and discussion is the most common stumbling block, but it's also the clearest one once you see it. Results state facts. Discussion argues points. Keep that distinction in your head as you write, and you'll stay on the right side of it.
Need Your Research Paper Done Right?
Our expert writers deliver every section results, discussion, methodology, with precision and zero AI.
- Turnitin proof with every order
- Rush orders delivery
- Subject expert writers
- Free revisions until you're satisfied
Don't gamble with your grade. Get expert help today.
Get Started Now
-20615.png)

-20655.png)
-20737.png)
-9374.jpg)


-20592.png)
 (1))
-20591.png)

-20668.png)
-20612.png)
-20657.png)


-20577.png)
-20575.png)


 (2))
)
 (1))
 (1))
 (1))
 (1))
 (1))
 (1))
-20419.png)
-20426.png)
-20431.png)
-20738.png)
-20739.png)
-20745.png)
-20755.png)