What Makes a Good Report Example?
Before we dive into the examples, let's talk about what you should actually look for. A good report example shows you three things:
Structure and organization. Reports aren't essays. They use clear headings, subheadings, and section breaks. Each part has a specific purpose, and you'll see that reflected in how the information is arranged. |
Language and tone. Reports tend to be more formal than essays, but they're not stuffy academic papers either. The language is clear, direct, and professional. You'll notice objective phrasing and an emphasis on facts rather than opinions (except in analytical reports where recommendations are expected). |
Visual elements. Unlike essays, reports often include tables, charts, bullet points, and other visual aids to present data. These aren't just decorative; they make complex information easier to digest. |
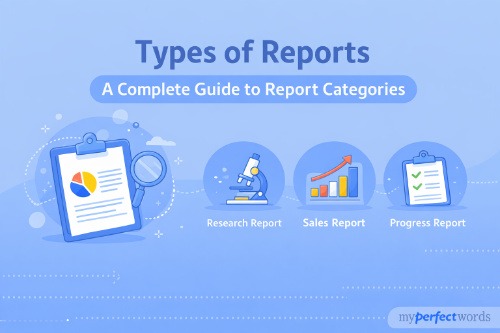
Understanding the different types of reports will help you identify which examples are most relevant to your needs.
Business Report Examples
Example 1: Market Analysis Report
Purpose: To analyze market conditions and provide actionable insights for business decisions.
Structure:
- Executive Summary (1 page)
- Market Overview (2-3 pages)
- Competitive Analysis (2-3 pages)
- Data and Findings (3-4 pages with charts)
- Recommendations (1-2 pages)
- Appendices (supporting data)
Sample Executive Summary:
This market analysis examines the growing demand for sustainable packaging solutions in North America. Research indicates a 34% year-over-year growth in consumer preference for eco-friendly packaging. Key competitors have increased investment in biodegradable materials by an average of 22%. Based on current trends and competitive positioning, we recommend expanding our sustainable product line within the next fiscal quarter.
What makes this effective:
This executive summary tells you everything upfront. A busy executive could read just this page and understand the main findings and recommendations. Data is specific (34%, 22%) rather than vague ("significant growth"). Each section has a clear purpose, and the recommendations aren't buried; they're prominently placed and directly tied to the findings.
Notice how visual elements work here: tables comparing competitors, bar charts showing market growth, and a matrix evaluating different packaging options. These aren't afterthoughts, they're essential to understanding the data. |
Example 2: Project Progress Report
Purpose: To update stakeholders on a project's status, highlighting what's on track and what needs attention.
Structure:
- Project Summary
- Progress Overview (milestones completed)
- Current Status by Deliverable
- Issues and Risks
- Next Steps and Timeline
Sample Progress Overview:
Phase 1 (Research & Planning) completed on schedule. All deliverables from Q1 have been approved by stakeholders. Phase 2 (Development) is currently 65% complete, with three of five modules finalized. One deliverable (Module 4) is two weeks behind schedule due to vendor delays. Risk mitigation plan has been implemented.
What makes this effective:
It's honest about both successes and challenges. Percentage completion gives a clear picture of where things stand. Issues aren't hidden; they're stated directly with explanations. More importantly, the report doesn't just say "we're behind", it explains why and what's being done about it.
Timeline sections use a Gantt chart to show dependencies. Color coding (green for on track, yellow for at risk, red for delayed) makes it easy to spot problems at a glance. This is what stakeholders actually need: clarity, not fluff. |
Academic Report Examples
Example 3: Lab Report (Science)
Purpose: To document a scientific experiment and analyze results objectively.
Structure:
- Title and Abstract
- Introduction (research question, hypothesis)
- Materials and Methods
- Results (with tables/graphs)
- Discussion
- Conclusion
- References
Sample Methods Section:
The experiment examined the effect of pH levels on enzyme activity. Solutions were prepared at pH 4, 5, 6, 7, 8, and 9 using buffer solutions. Enzyme samples (2ml each) were added to substrate solutions at room temperature (22°C). Reaction rates were measured at 30-second intervals for five minutes using a spectrophotometer. Each pH level was tested three times to ensure reliability.
What makes this effective:
Every detail needed to replicate the experiment is here. Language is precise and objective, no "we thought" or "it seemed like." Measurements are specific (2ml, 22°C, 30-second intervals). Passive voice ("were prepared," "were measured") is appropriate here because the focus is on the procedure, not who did it.
Results tables are clearly labeled with units. Graphs include error bars showing data reliability. Discussion sections interpret the data without overstating conclusions. This is what scientific writing should look like: clear, replicable, and honest about limitations. |
Example 4: Research Report (Social Sciences)
Purpose: To investigate a research question and present findings based on data analysis.
Structure:
- Abstract
- Literature Review
- Research Methodology
- Findings and Analysis
- Conclusion and Implications
- References
Sample Findings Section:
Survey data from 450 participants revealed that 67% reported increased stress levels during remote work transitions. Qualitative interviews identified three primary stressors: lack of clear boundaries between work and personal life (mentioned by 82% of interviewees), reduced social interaction (mentioned by 71%), and technical difficulties (mentioned by 54%). These findings align with previous research by Smith (2023) and Johnson (2024) but extend our understanding of how these factors interact.
What makes this effective:
Numbers tell a story here. You're not just told "many people felt stressed"; you see exactly how many and what caused it. Integration of quantitative data (survey percentages) with qualitative insights (interview themes) gives you a fuller picture.
Notice how findings connect to existing research. This isn't just data dumping; it's showing where this work fits into the broader conversation. Language stays neutral and analytical throughout. You're reading conclusions drawn from evidence, not opinions presented as facts. |
Technical Report Examples
Example 5: Engineering Report
Purpose: To document technical specifications, analysis, and recommendations for an engineering project.
Structure:
- Executive Summary
- Technical Specifications
- Analysis and Calculations
- Design Considerations
- Recommendations
- Technical Drawings (Appendices)
Sample Analysis Section:
Structural load calculations indicate the current bridge design can support a maximum load of 15,000 kg per vehicle. Based on traffic data showing 12% of vehicles exceed 12,000 kg, we recommend reinforcement of support beams at junctions B-4 and C-7. Alternative materials analysis shows high-grade steel (Grade 50) provides optimal strength-to-cost ratio compared to alternatives tested. Safety factor of 1.5 has been applied to all calculations per industry standards.
What makes this effective:
Technical detail is there but presented clearly. Even if you're not an engineer, you can understand the basic issue: the bridge needs reinforcement for heavier vehicles. Specific locations are identified (B-4, C-7) so there's no ambiguity about what needs to be done.
Recommendations are justified with data and calculations. Cost-benefit analysis for materials is referenced, not just stated. Safety considerations are explicitly mentioned. Technical drawings in appendices show exactly what's being proposed. This is how you communicate complex technical information, with precision but also clarity. |
Struggling to Write Your Report?
Let our professional writers handle it while you focus on other priorities.
Join countless students who've trusted us with their reports.
Example 6: IT System Report
Purpose: To analyze system performance and recommend improvements for IT infrastructure.
Structure:
- System Overview
- Performance Metrics
- Issues Identified
- Risk Assessment
- Recommendations
- Implementation Timeline
Sample Performance Metrics:
Current server response times average 3.2 seconds, exceeding the industry standard of 2.0 seconds by 60%. Database queries processing speed has declined 25% since Q1, indicating potential indexing issues. System uptime over the past 90 days was 97.3%, falling short of our 99.5% target. User-reported incidents increased 40% in the last quarter, primarily related to slow load times and timeout errors.
What makes this effective:
Numbers immediately tell you there's a problem. You're not reading vague statements like "the system is slow"; you see exactly how slow and how much it's declined. Benchmarks and targets are included (2.0 seconds, 99.5% uptime) so you can judge severity.
Executive summary is written for non-technical stakeholders. It explains what the problems mean for the business (lost productivity, user frustration) without drowning readers in technical jargon. Technical details are in appendices for those who need them. This is good technical communication, accessible to decision-makers but detailed enough for implementation. |
Informational Report Examples
Example 7: Descriptive Report (Company Overview)
Purpose: To present factual information about an organization without analysis or recommendations.
Structure:
- Company Background
- Products and Services
- Organizational Structure
- Market Position
- Operational Overview
Sample Overview:
TechStart Solutions, founded in 2018, specializes in cloud-based project management software for small to medium-sized businesses. The company currently serves 2,400 clients across 15 countries. Headquarters are located in Austin, Texas, with additional offices in London and Singapore. The product line includes three tiers: Basic ($29/month), Professional ($79/month), and Enterprise (custom pricing). The team consists of 120 employees: 45 in engineering, 30 in sales, 25 in customer support, and 20 in administration.
What makes this effective:
Pure information, zero spin. You're getting facts, when the company was founded, what it does, how many clients it has, where it operates. Language is neutral and objective. There's no "industry-leading" or "innovative" unless those are provable facts.
Structure is logical: you start with what the company is, then move to what it does, how it's organized, and where it operates. Each section can stand alone. This is what a descriptive report should do: inform without persuading, present without analyzing. |
Example 8: Annual Report Summary
Purpose: To summarize a company's financial and operational performance over a fiscal year.
Structure:
- Year in Review
- Financial Highlights
- Operational Achievements
- Challenges and Responses
- Looking Ahead
Sample Financial Highlights:
Fiscal Year 2025 revenue totaled $12.4 million, representing 18% growth compared to FY 2024 ($10.5 million). Gross profit margin improved from 42% to 47%, reflecting increased operational efficiency. Customer acquisition cost decreased 15% while customer lifetime value increased 22%. Operating expenses as a percentage of revenue declined from 38% to 34%. Cash reserves as of December 31, 2025: $3.2 million.
What makes this effective:
Every claim is supported by specific numbers. You're not told business was "strong" or "improved"; you see exactly how much it grew and in what areas. Year-over-year comparisons provide context. Metrics chosen tell a story about financial health: revenue up, efficiency up, costs down, cash reserves healthy.
Visual elements include bar charts showing revenue trends, pie charts breaking down revenue by product line, and tables comparing key metrics across years. These make the numbers easier to understand at a glance. Stakeholders can quickly grasp the company's position without reading pages of text. |
Analytical Report Examples
Example 9: Problem-Solution Report
Purpose: To analyze a problem, evaluate potential solutions, and recommend the best course of action.
Structure:
- Problem Statement
- Background and Context
- Analysis of Causes
- Solution Options Evaluated
- Recommended Solution
- Implementation Plan
Sample Solution Comparison:
Three solutions were evaluated based on cost, implementation time, and effectiveness. Option A (upgraded software) costs $45,000, requires 6 weeks implementation, and addresses 85% of identified issues. Option B (staff training program) costs $15,000, requires 4 weeks, and addresses 60% of issues. Option C (combined approach) costs $52,000, requires 8 weeks, and addresses 95% of issues. While Option C has the highest upfront cost, the ROI analysis shows it pays for itself within 18 months through reduced error rates and increased productivity.
What makes this effective:
Options are compared systematically using consistent criteria. Decision isn't arbitrary; you can see exactly why Option C was chosen despite the higher cost. ROI calculation justifies the recommendation with concrete numbers. Risks are acknowledged (higher upfront investment) but weighed against benefits (comprehensive solution, long-term value).
Problem statement at the beginning is specific and measurable. You're not reading "things aren't working well", you're seeing "error rates increased 23% over six months, costing approximately $30,000 in lost productivity." That specificity makes the solution evaluation meaningful. |
Example 10: Feasibility Report
Purpose: To determine whether a proposed project or initiative is viable and worth pursuing.
Structure:
- Project Overview
- Evaluation Criteria
- Technical Feasibility
- Financial Feasibility
- Market Feasibility
- Conclusion and Recommendation
Sample Financial Feasibility:
Initial investment required: $180,000 (equipment: $120,000, training: $25,000, marketing: $35,000). Break-even analysis indicates 14 months to recover costs at projected sales volume of 250 units monthly. Best-case scenario (350 units/month) achieves break-even in 10 months. Worst-case scenario (150 units/month) extends break-even to 24 months. Risk analysis identifies supply chain reliability as primary concern, with mitigation plan including backup suppliers and inventory buffers.
What makes this effective:
Feasibility is evaluated across multiple dimensions, not just "can we do this," but "should we do this." Financial analysis includes best, expected, and worst-case scenarios. You're not just seeing optimistic projections, you're seeing what happens if things don't go perfectly.
Risks are identified with mitigation strategies. Conclusion isn't "yes" or "no", it's "yes, if these conditions are met" or "no, because these obstacles can't be overcome." This is realistic assessment, not wishful thinking. Decision-makers get enough information to make an informed choice. |
Bonus: Common Report Mistakes (What NOT to Do)
Example 11: Poor Report Structure
What's wrong: Headings are vague ("Introduction," "Body," "Conclusion"), sections aren't logically organized, and the report reads like an essay with headings slapped on. Information you need early is buried in the middle. There's no clear path through the content.
How to fix: Use descriptive headings that tell readers what's in each section ("Q3 Sales Analysis" instead of "Section 2"). Organize information logically: background before analysis, analysis before recommendations. Front-load important information. Use subheadings to break up long sections. Think about what your reader needs to know and when they need to know it.
Example 12: Weak Executive Summary
What's wrong: The summary is either too vague ("This report discusses various aspects...") or too detailed (repeating everything from the body). It doesn't answer the key question: "What do I need to know, and what should I do about it?"
How to fix: Your executive summary should answer four questions in one page or less: What was examined? What did you find? What does it mean? What should we do? Be specific with numbers and clear with recommendations. If someone only read the executive summary, they should understand the core message and recommended actions.
Key Takeaways
Now that you've seen 10+ report examples, here are the patterns you should've noticed:
- Every strong report starts with clarity. You know immediately what the report is about, who it's for, and what question it answers. Whether it's a lab report explaining an experiment or a business report analyzing market trends, the purpose is crystal clear from the first paragraph.
- Structure matters more than you think. Reports aren't meant to be read cover to cover like a novel. Readers should be able to jump to the section they need. Clear headings, logical organization, and consistent formatting make that possible.
- Data tells the story. Vague statements like "sales increased significantly" don't cut it in reports. Specific numbers, percentages, and comparisons give readers the information they need to make decisions. Tables and charts aren't just decorative; they're essential tools for presenting complex data clearly.
- Recommendations are tied to evidence. In analytical reports, you don't just say "we should do X." You explain why X is the best option based on the data and analysis presented. Your reasoning should be easy to follow.
Now that you've seen what works, you can use these as references while writing your own.
Ready to Get Your Report Done? Professional writers. Guaranteed quality. Delivered on time. Get started in under 5 minutes. No hidden fees.